
The Dashboard is your “home base” while using Kapta. You can always reach your Dashboard via the left menu.
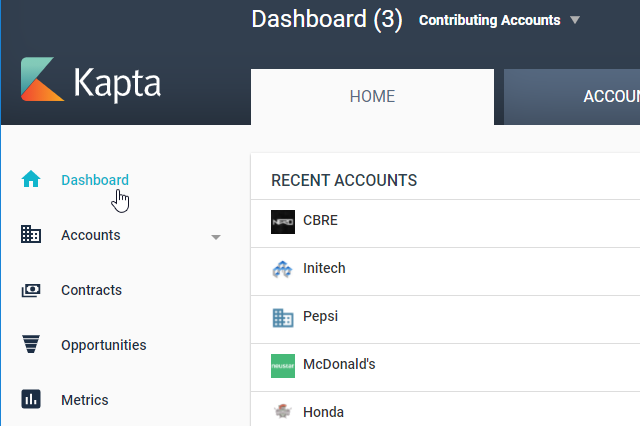
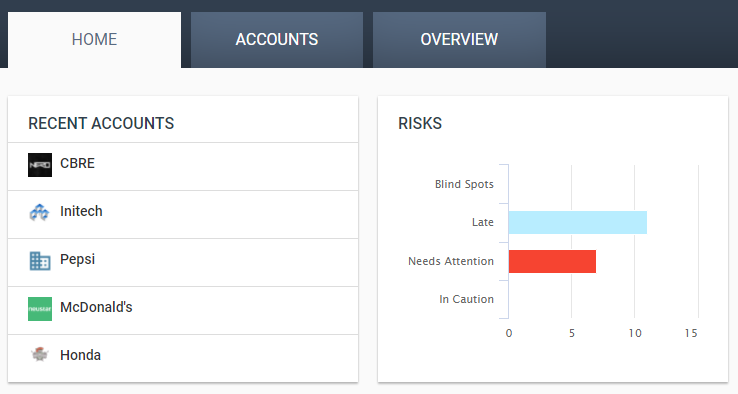
The HOME tab displays the list of accounts you've worked on recently, as well as a summary of actions listed as blind spots, late, need attention, or in caution. What's displayed here, and throughout the Dashboard, depends on the current account filter. Clicking an account takes you to that account's DETAILS tab, and clicking a risk bar opens the list of relevant actions.
Below these summaries are lists of your tasks and actions.
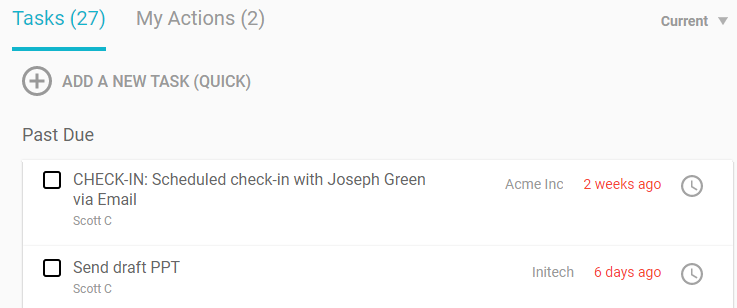
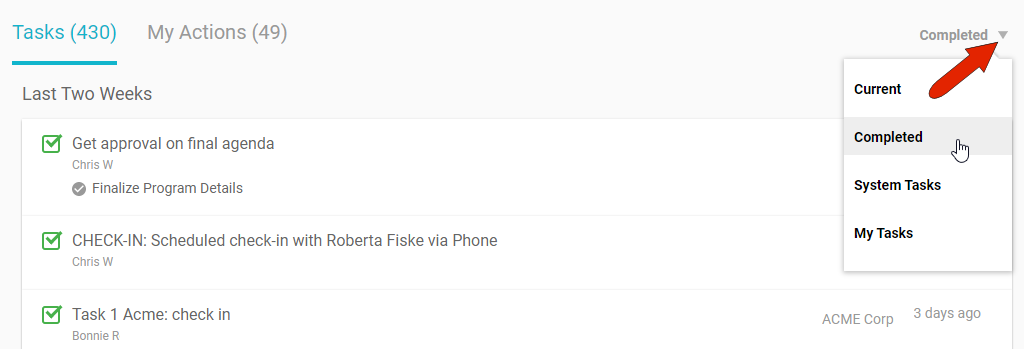
Each of these lists can be changed by changing the filter. For example, when viewing your Tasks list, you can view current tasks, completed tasks, or only your tasks.
The list of actions has similar filters. Other types of filters appear throughout the UI for different types of lists.
The ACCOUNTS tab provides an at-a-glance, comprehensive look at the status of the accounts produced by the current accounts filter. Below this are recent account notes.
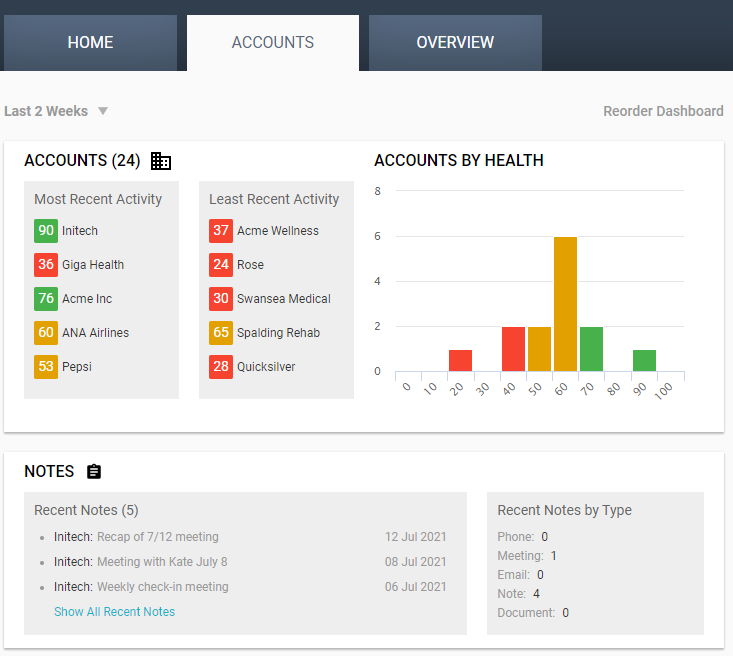
Below Notes are details on contact mapping and engagement, and the four standard that indicate how many accounts are green, in good shape, or those that need attention, in orange or red. Metrics are configured by the administrator, in conjunction with Kapta. Clicking View Metric Details presents detailed data for the four standard metrics, as well as all other metrics configured by the administrator.
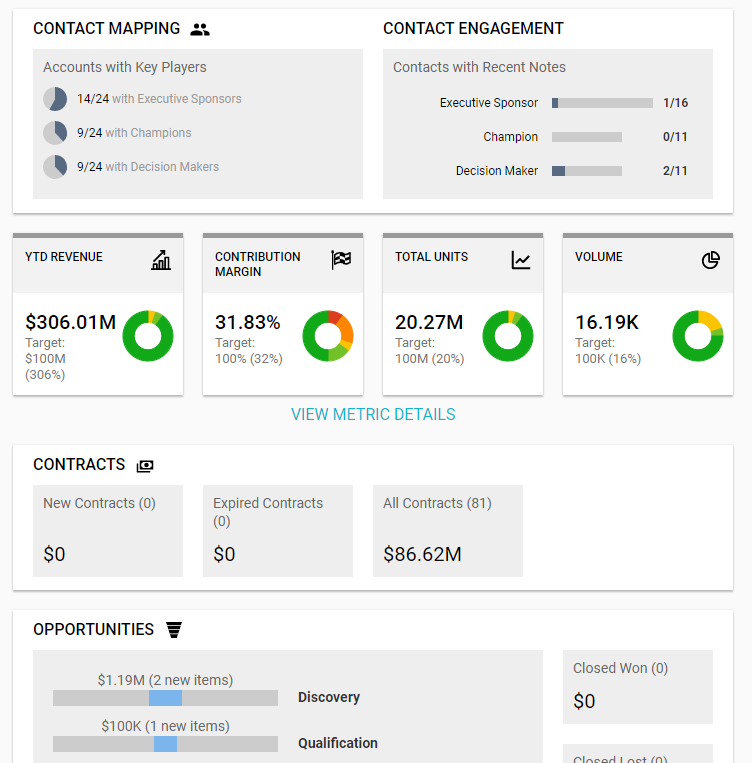
Below metrics you'll find more account summary data, for contracts, opportunities, actions, and tasks.
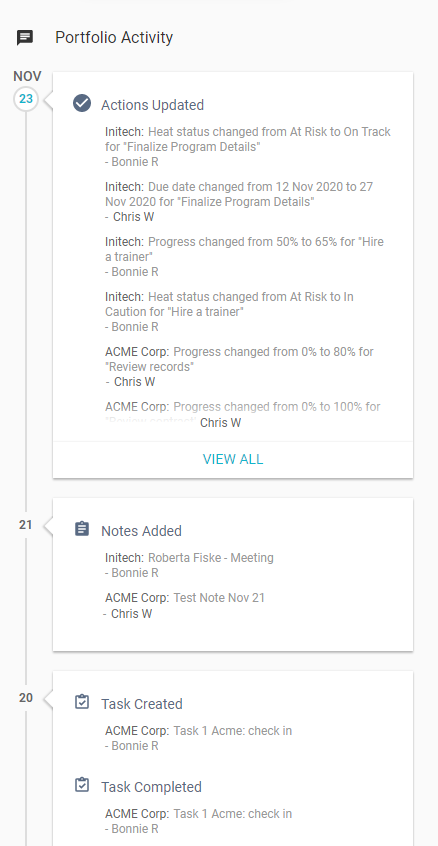
Along the right side of the Dashboard is a running list of recent activities performed by you and other team members.
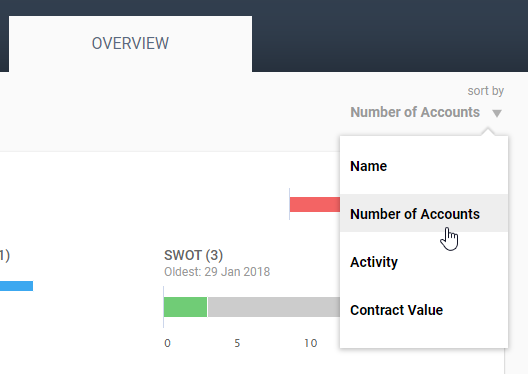
For administrators, the OVERVIEW tab displays data on Kapta users on your team.
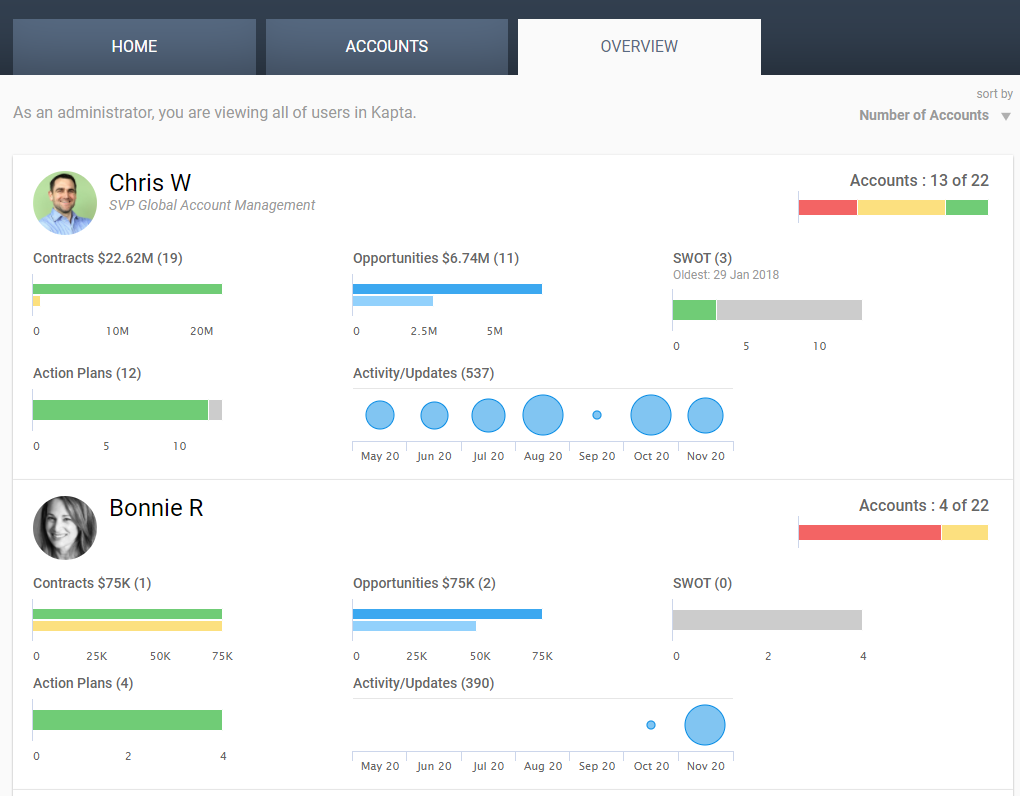
You can sort the list by name, number of accounts, activity, or contract value.
For each user, you can see the health of their accounts and how they are doing in other metrics such as contracts or opportunities.
Comments
0 comments
Article is closed for comments.