
Clicking Metrics in the left menu displays metrics for your entire portfolio - all of your company’s accounts.
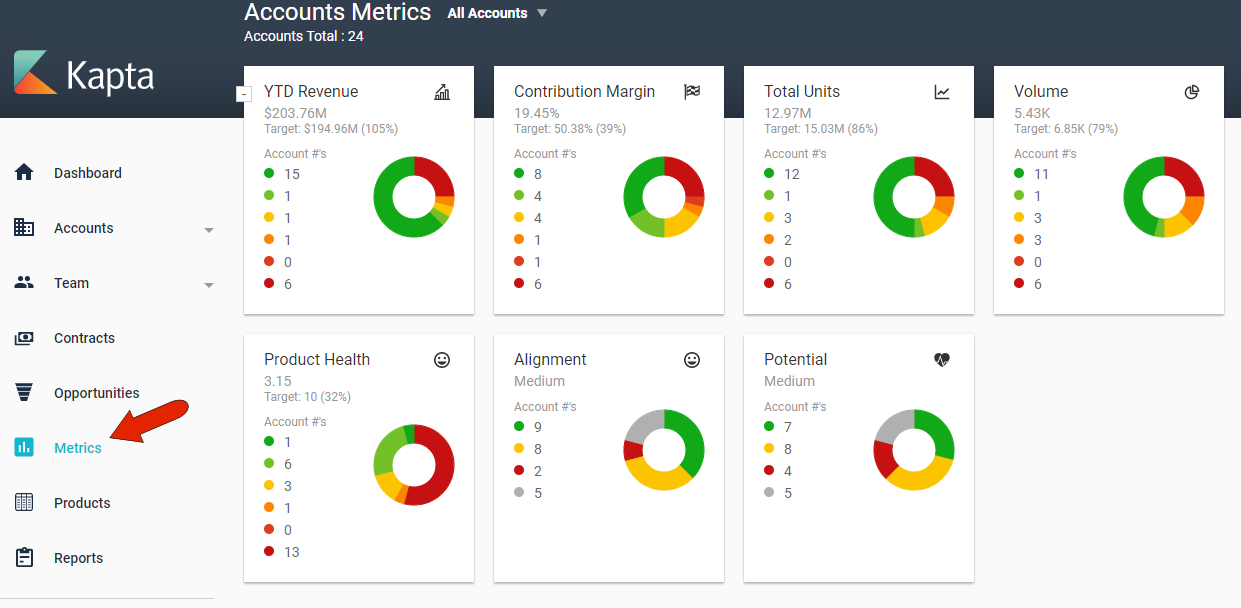
These metrics and their data are generally set up by the administrator, in conjunction with Kapta, as part of your license. The color coding provides an at-a-glance view of how your portfolio is doing as a whole.
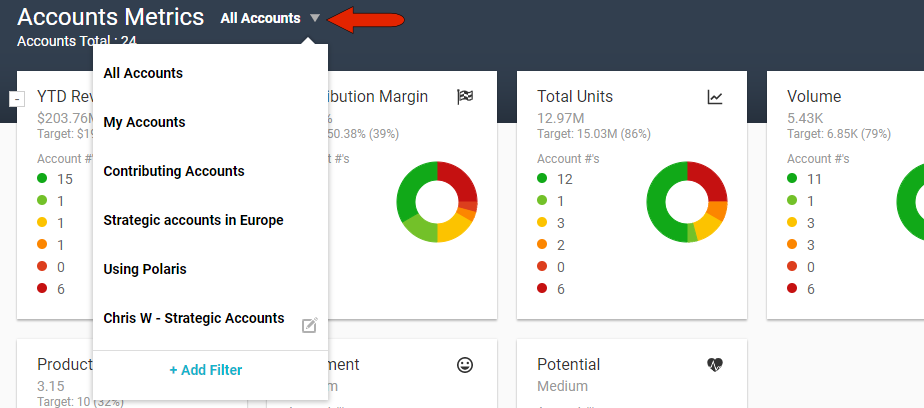
To narrow the list of accounts for which metrics are presented, click the Account Filter drop-down at the top left. You can choose My Accounts, which are accounts for which you’re the owner, or accounts for which you’re a contributor. The administrator can set up additional system-wide account filters, and you can click Add Filter to create your own filter which will be available only to you. For example, you can create a filter to include only accounts with a specific owner, or in a specific region, or that include specific products.
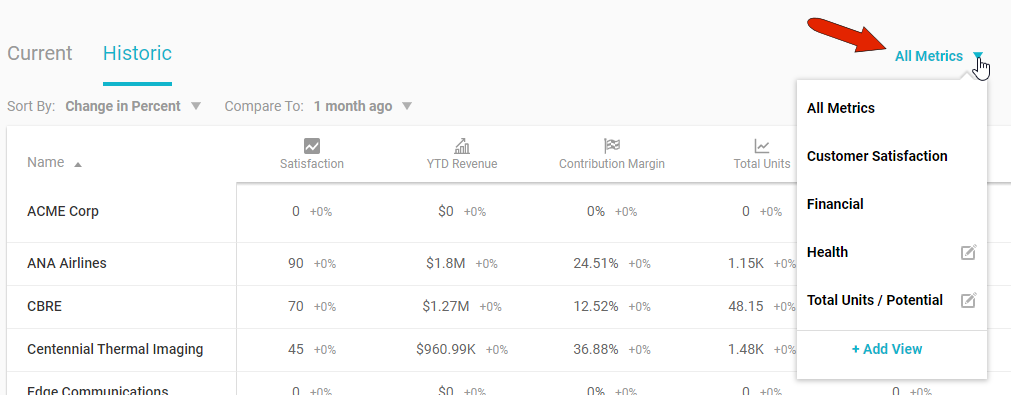
Below the metric summaries are tables that break down metrics by account. In addition to account filters, you can also filter metric views. As with account filters, the administrator can set up system-wide metrics views, and you can click Add View to create your own views. As an example, you set up a metric view to show metrics related to Account Health, or Total Units and Potential.
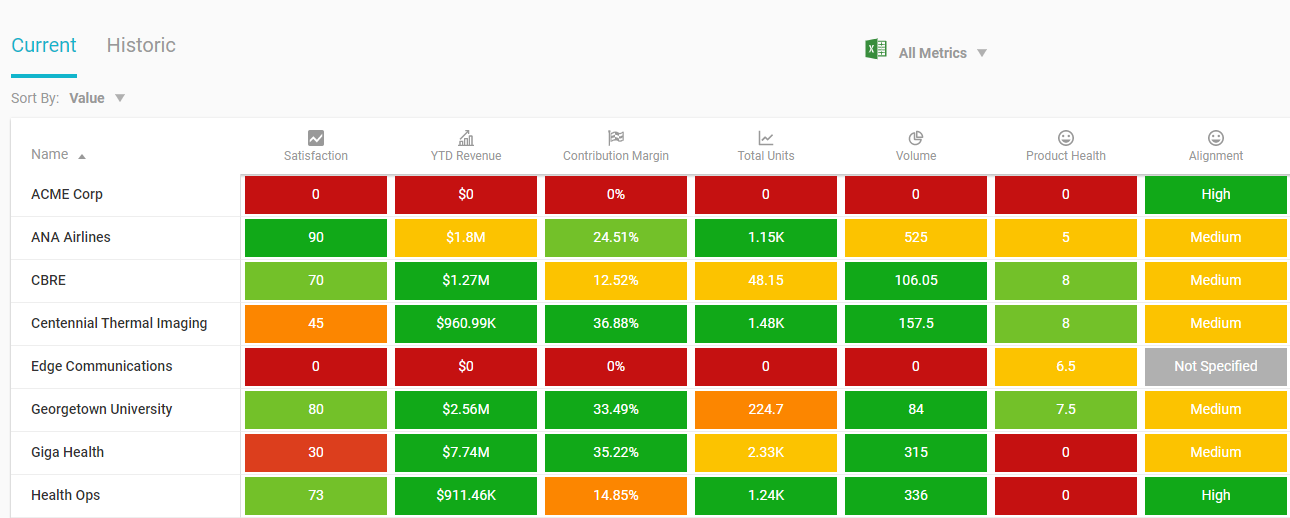
The sortable Current metrics table shows the current state of account metrics. This table can be downloaded as a spreadsheet.
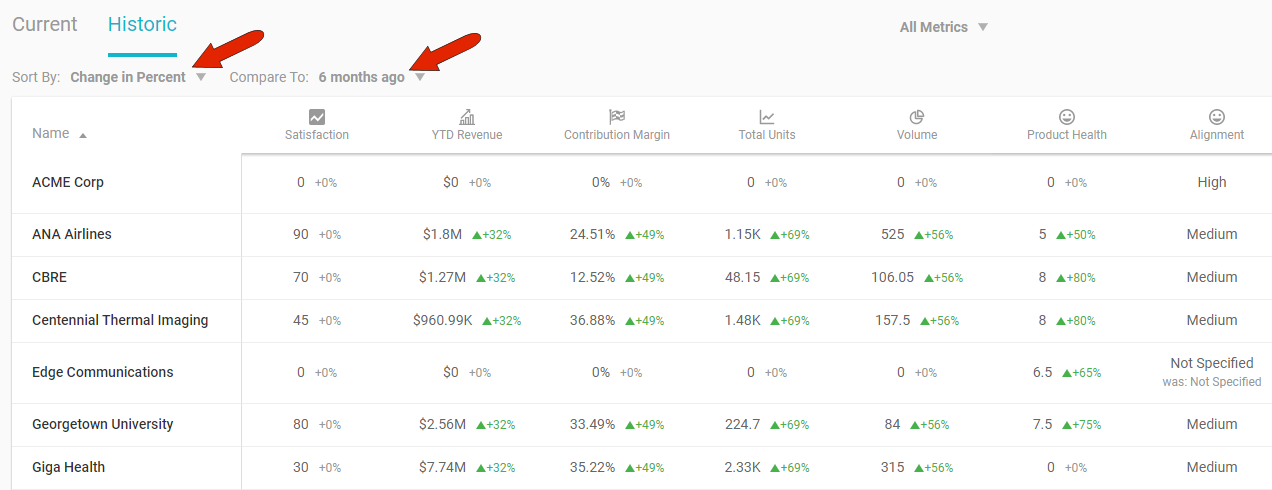
The Historic table is sortable as well, and reflects gains and losses in metric data compared with data from the time period set at the top of the table. The table can be sorted by changes in color, value, or percent.
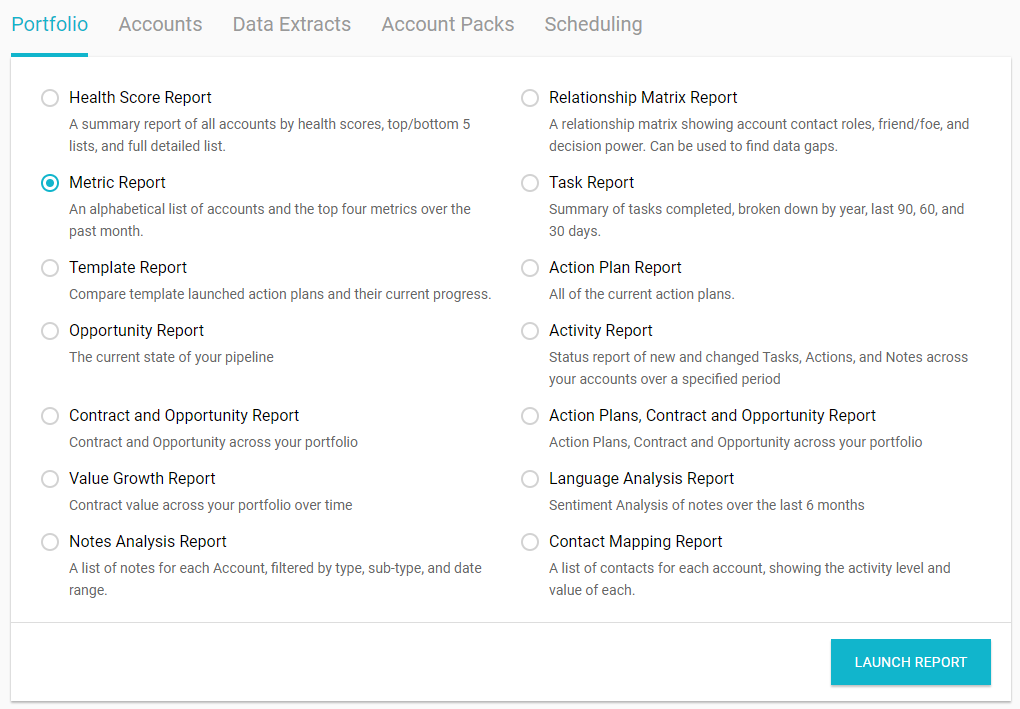
To download a report of portfolio metrics, open Reports from the left menu and open the Portfolio tab. This list includes all available portfolio-level reports, which are set up by the administrator. Here you’ll find, if enabled, the Metric report, which includes each account’s top four metrics.
Comments
0 comments
Article is closed for comments.