
Clicking Opportunities in the left menu opens a list of all opportunities for your entire portfolio - all of your company’s accounts.
These include opportunities added to accounts manually from within Kapta, as well as opportunities imported by the administrator.
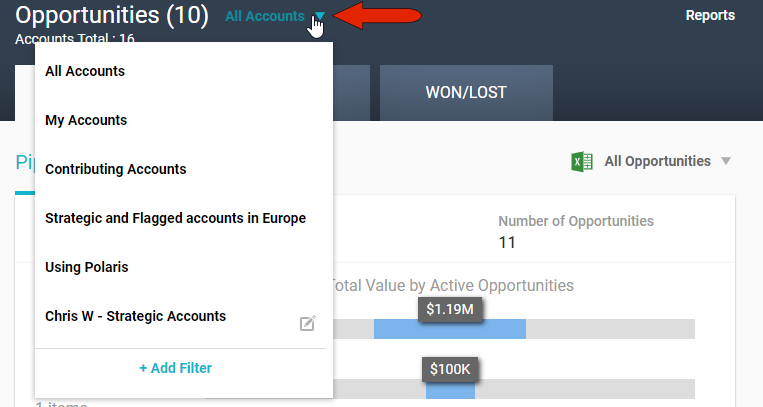
To narrow the list of accounts for which opportunities are listed, click the Account Filter drop-down at the top left. You can choose My Accounts, which are accounts for which you’re the owner, or accounts for which you’re a contributor. The administrator can set up additional system-wide account filters, and you can click Add Filter to create your own filter which will be available only to you. For example, you can create a filter to include only accounts with a specific owner, or in a specific region, or that include specific products.
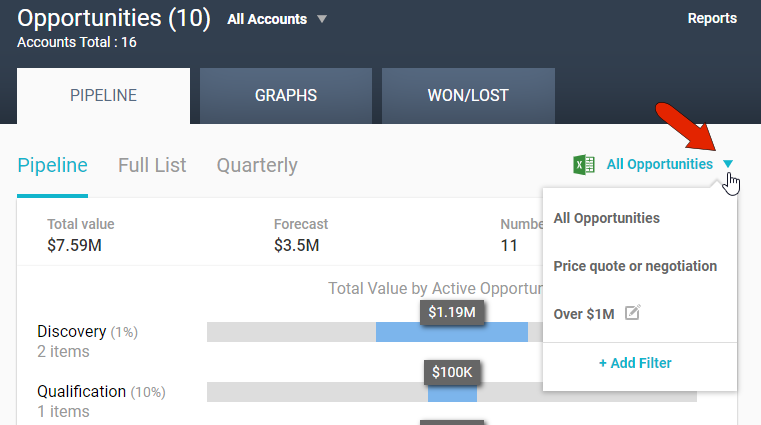
In addition to account filters, you can also filter the opportunities themselves. As with account filters, the administrator can set up system-wide opportunities filters, and you can create your own filters. As an example, you can filter opportunities to show only those with a value over a specific amount, or those at specific stages.
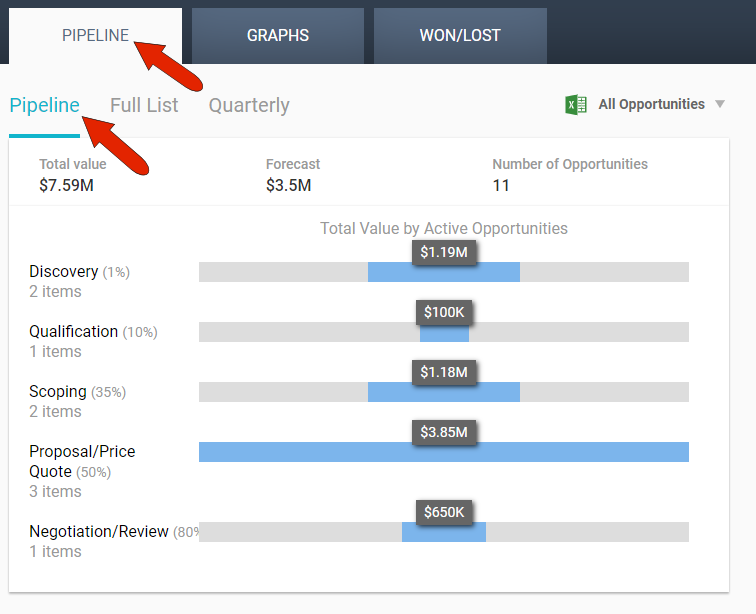
The Opportunities page provides different views of your opportunities in three tabs: PIPELINE, GRAPHS, and WON/LOST.
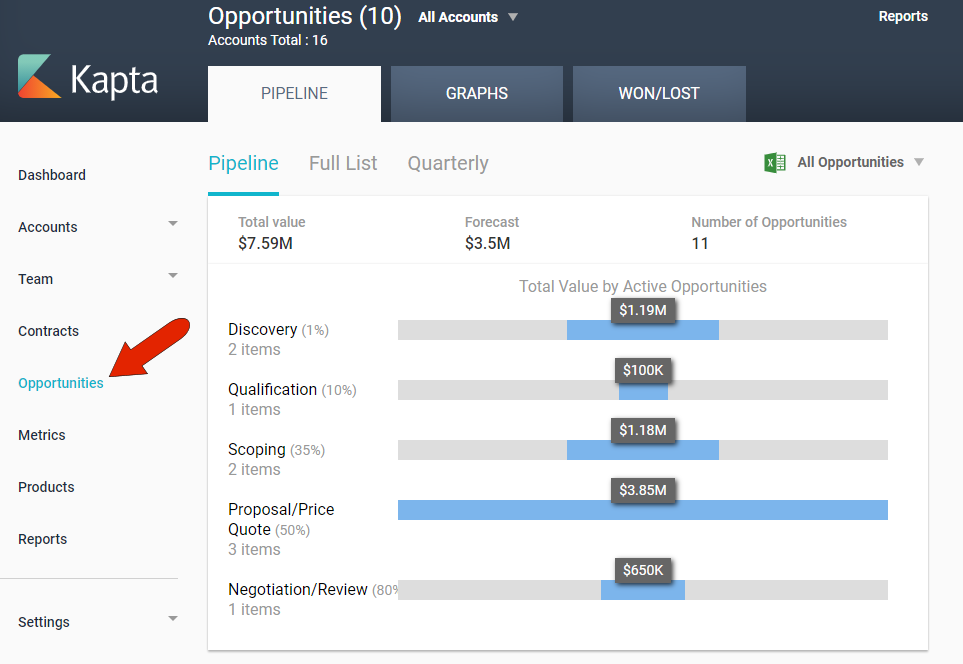
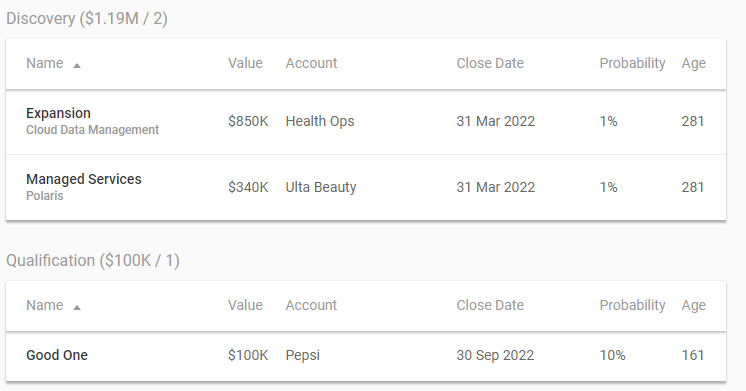
In the PIPELINE tab, the Pipeline view lists opportunities broken down by stage. Stages and their probabilities are configured by the administrator. At the top is an overview of total value and forecast in each stage.
Below the table of total values are sortable breakdown tables by stage.
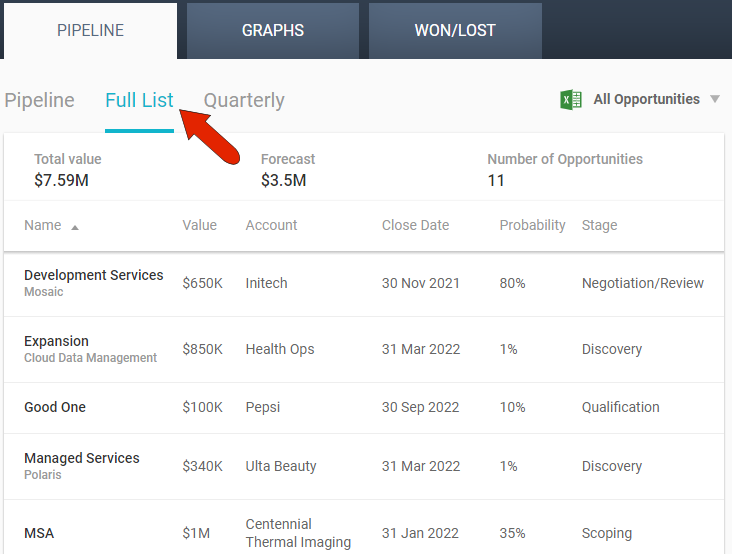
The Full List view displays all opportunities in one sortable table.
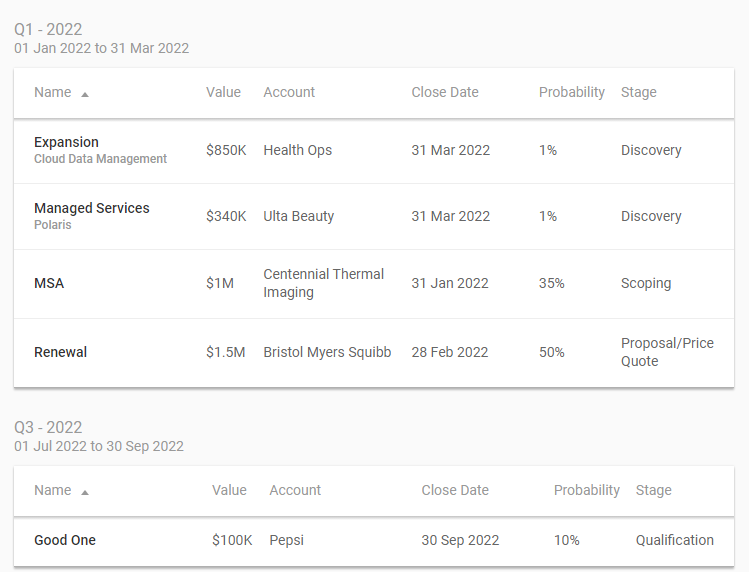
The Quarterly view presents opportunities by quarter, with a quarterly summary at the top.
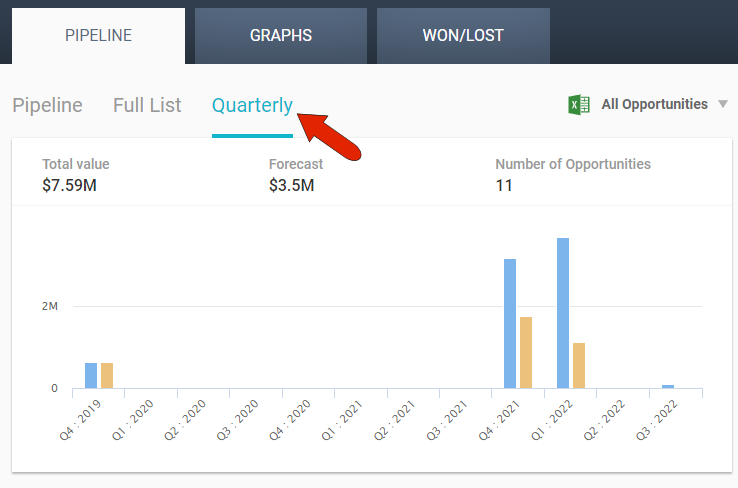
Below the summary is a list of opportunities for each quarter.
On any of the views in the PIPELINE tab, clicking an opportunity opens its edit window, and clicking an account name will take you to that account’s DETAILS tab. In all views, you can download the opportunities list as a spreadsheet.
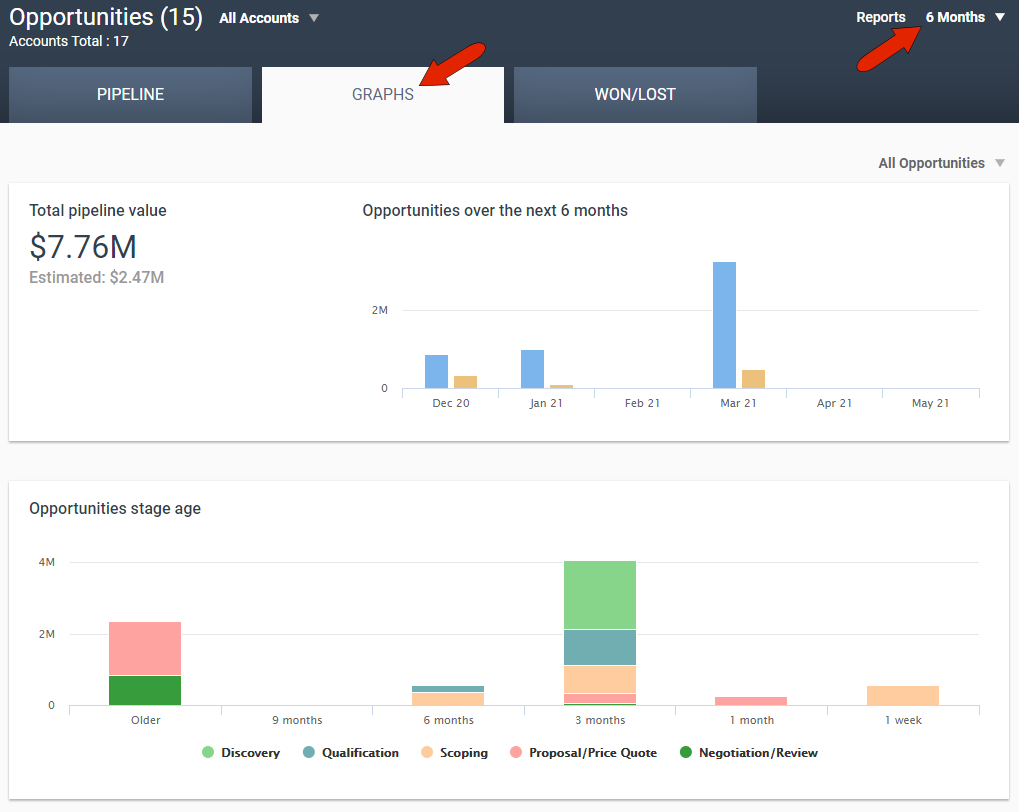
The GRAPHS tab displays graphical views of pipeline value, stage age, closed / lost, and stages, based on the time period set at the top right.
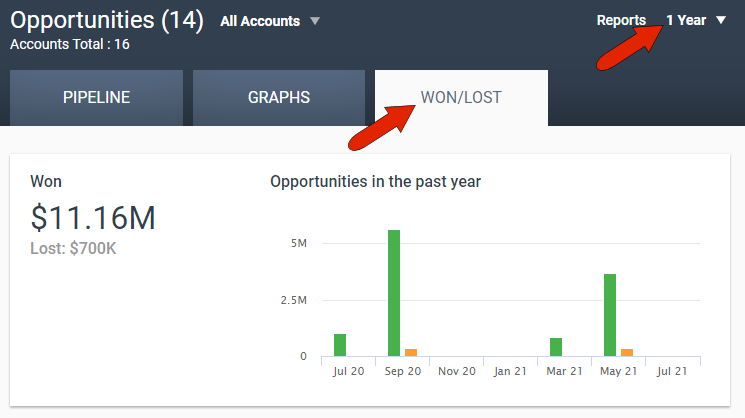
The WON/LOST tab breaks down opportunities closed upon or lost, based on the time period set at the top right. The summary at top presents all won opportunities.
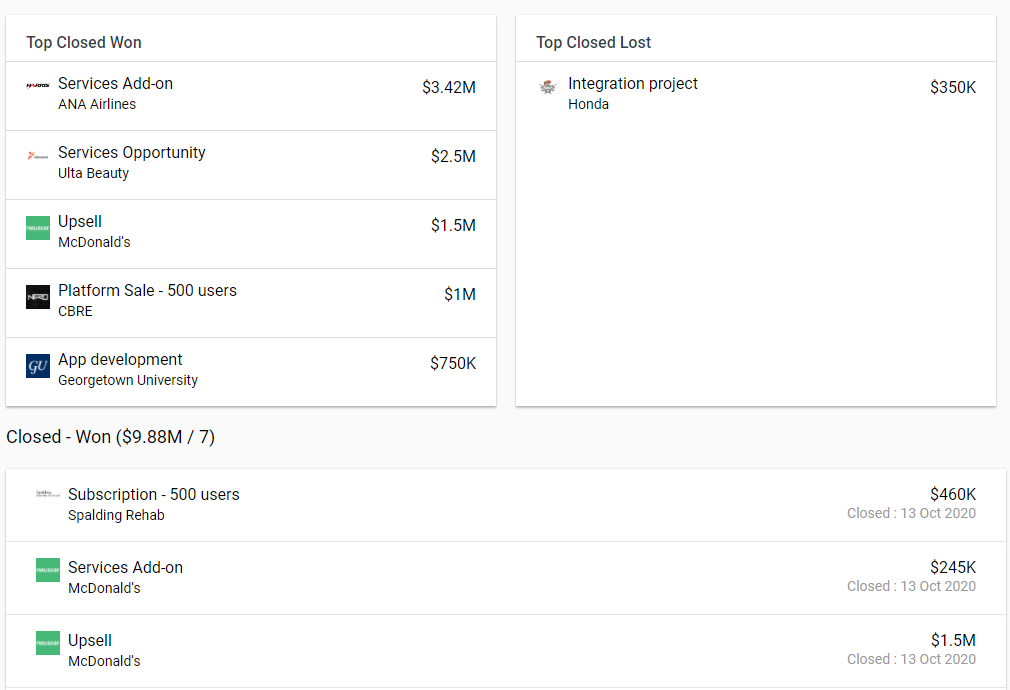
Below the summary at the top are the top won and lost opportunities, followed by the complete list of all won and lost opportunities.
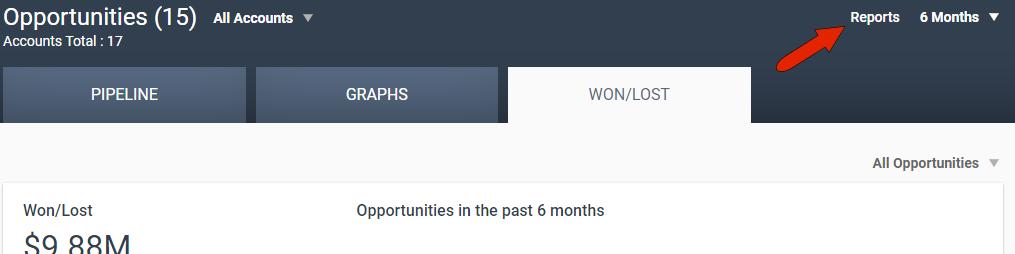
To download either the Opportunity Timeline or Opportunity Report, click the Report link at the top right.
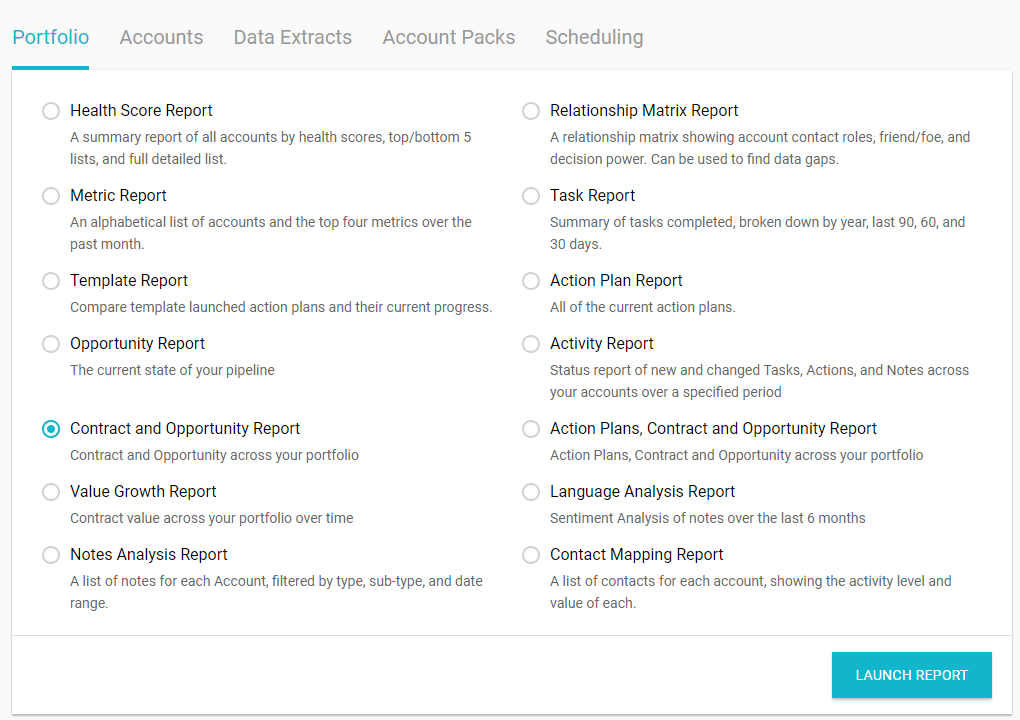
For more reports options, open Reports from the left menu, available to administrators and account managers. In the Portfolio tab, you’ll find, if enabled, the Contracts and Opportunities report, and the Actions Plans, Contracts and Opportunities report. Available reports are set up by the administrator.
Comments
0 comments
Please sign in to leave a comment.