
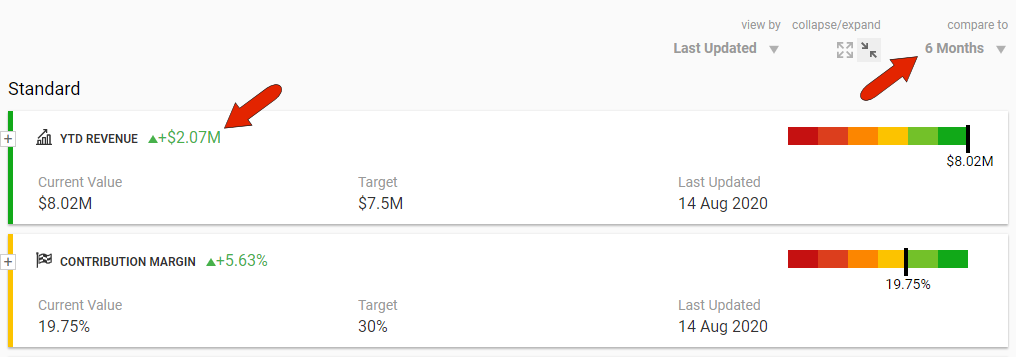
Just below the account health score in the Metrics section of an account DETAILS tab, you’ll find a summary of the top four account metrics. Working with Kapta on metrics setup, the administrator determines which metrics will be used, which of those are the top four, what constitutes metric success, and how they are color-coded.
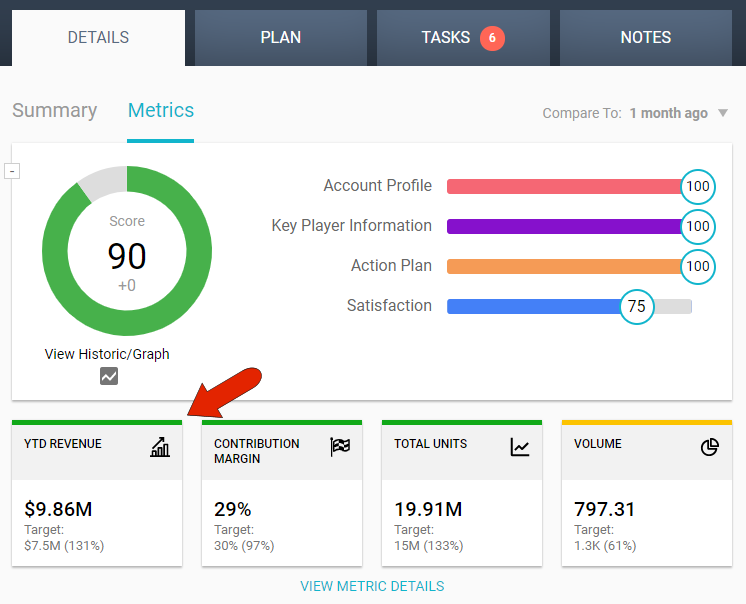
The company data that appears, such as YTD Revenue or Total Units, are configured by Kapta to be pulled in automatically and frequently, from external sources. Color coding is determined by comparing each metric to its target value.
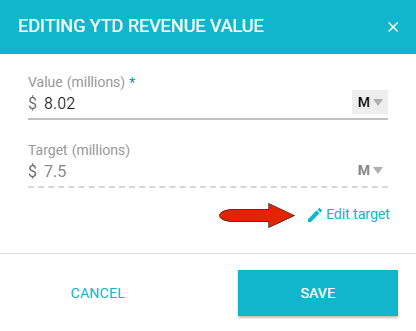
The administrator sets default metric targets. If you have the correct permissions, also set by the admin, you can edit metric values as well as target values. To edit a target, click the Edit Target link.
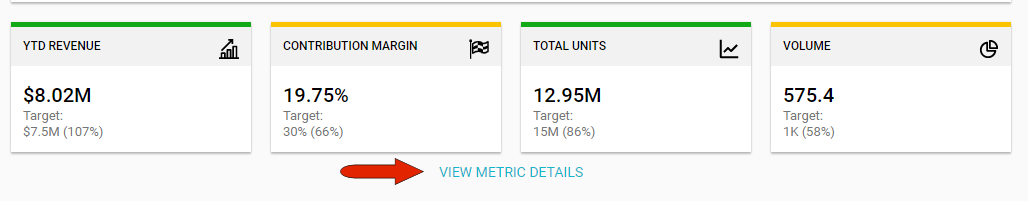
To view and edit all metrics details, beyond the summary view of the top four, click View Metric Details.
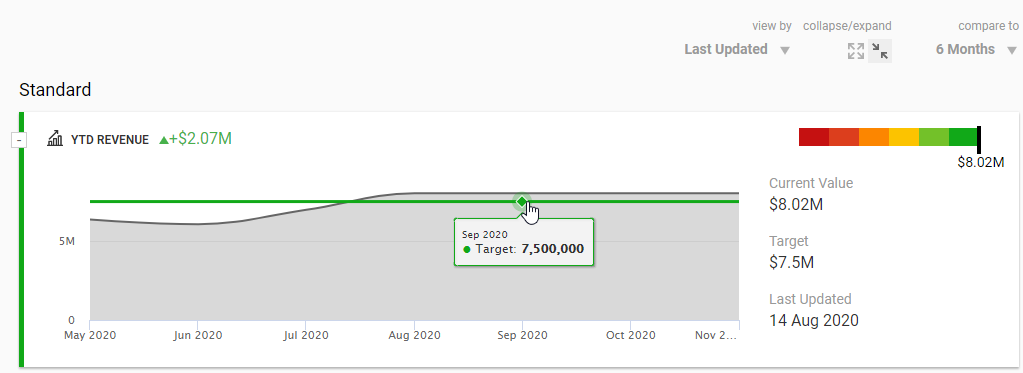
This page displays all metrics set up by the administrator, grouped by metric families which are also set up by the administrator. You can show metrics from today or from the last time they were updated.
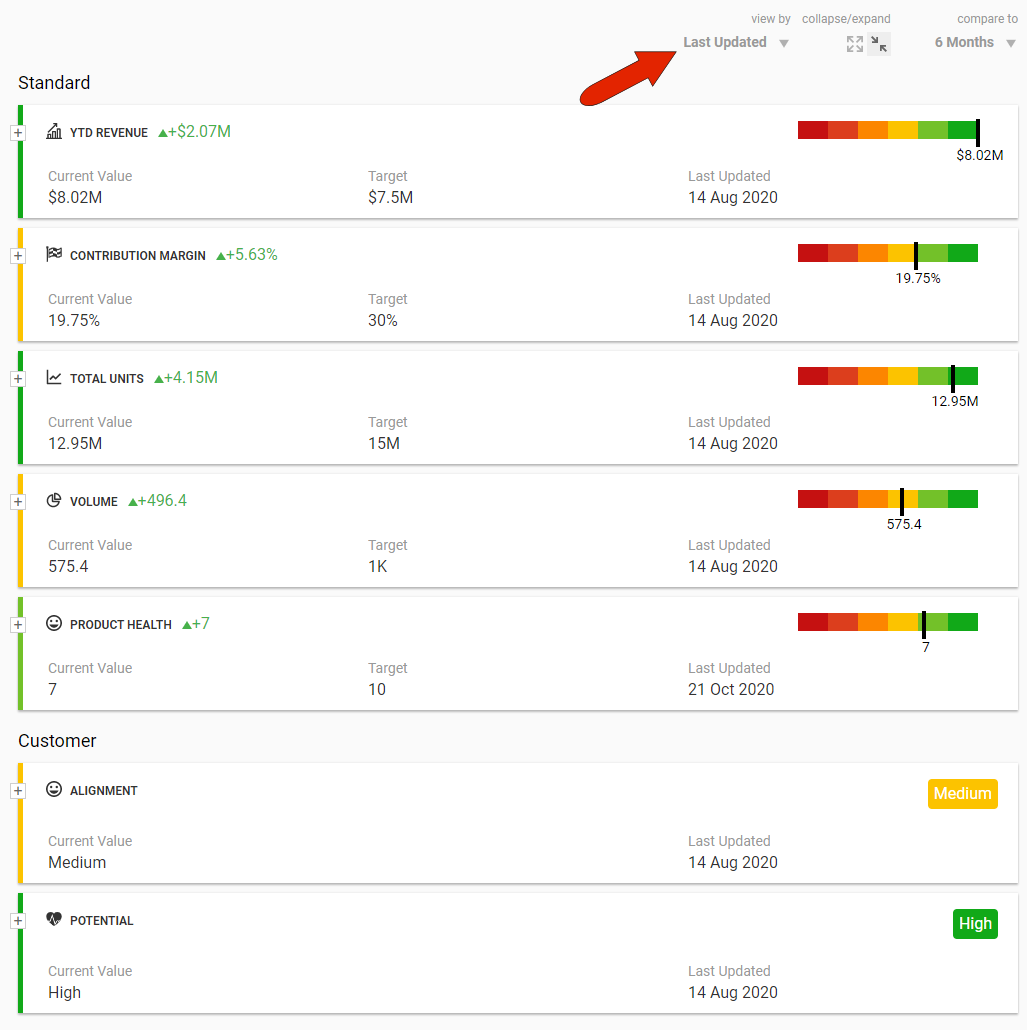
Each metric is shown with its recent gain or loss, when compared with data from the time period set at the top right.
In this list view, with the correct permissions, you can click any metric to change its value or target.
Expanding a metric section presents a timeline view of change over time, according to the time period set at the top right.
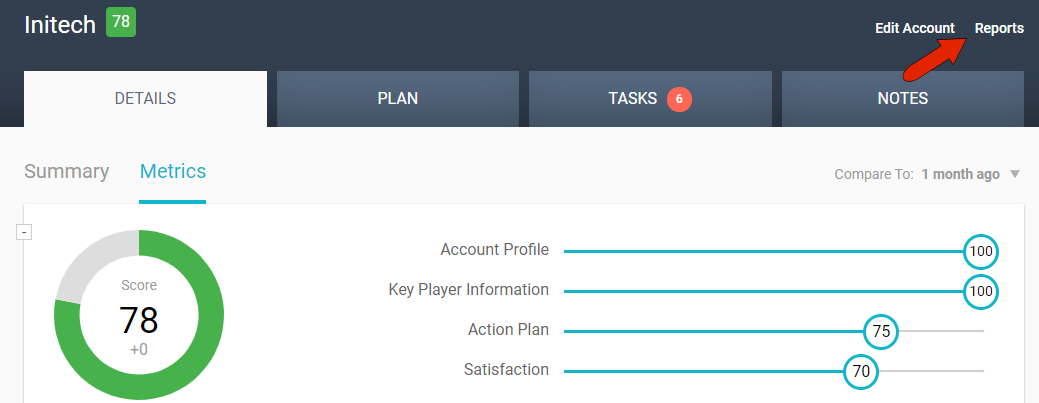
To download a report of an account’s metric details, click the Reports link at the top right.
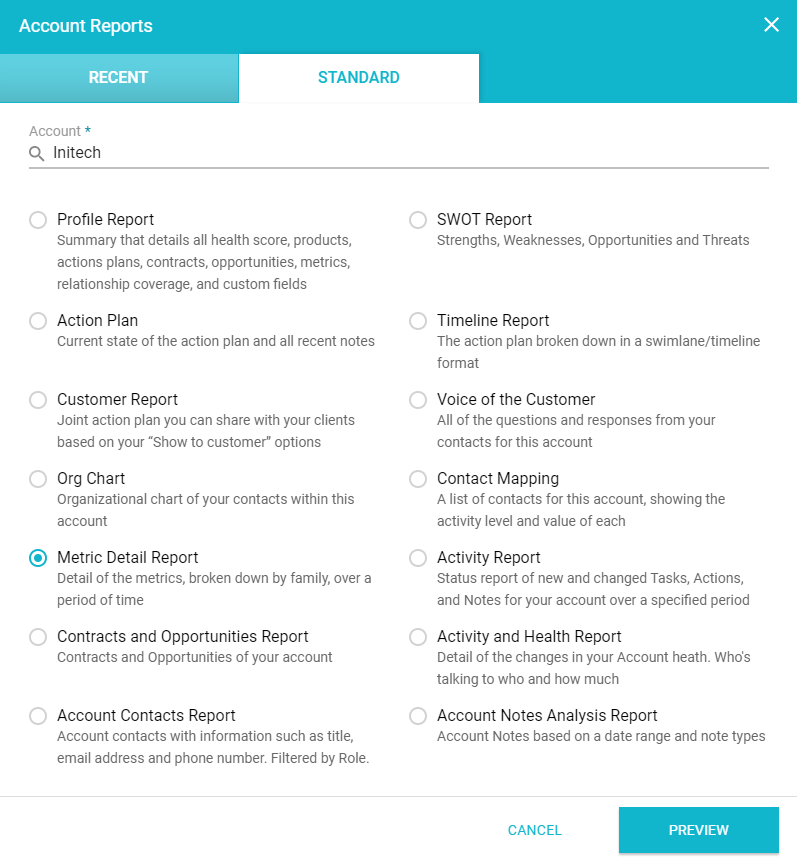
The STANDARD tab lists of all available reports set up by the administrator. Here you’ll find, if enabled, the Metric Detail report.
Comments
0 comments
Article is closed for comments.